After 2,5 years construction time, in September 2014 the 50 meter high double curvature Sarvsfossen dam was completed in Bykle in the Aust-Agder province as part of the 'Brokke Nord/Sør' project. It is the largest concrete dam built in Norway since the 1980s. The structure dams the river Otra that flows south through the valley of Setesdalen. The annual energy output of this hydropowerproject is 69 GWh. Together with additional energy from existing stations downstream, a total of 175 GWh of renewable energy has been added to the regional grid.
38
thema
Sarvsfossen Dam
1
Design
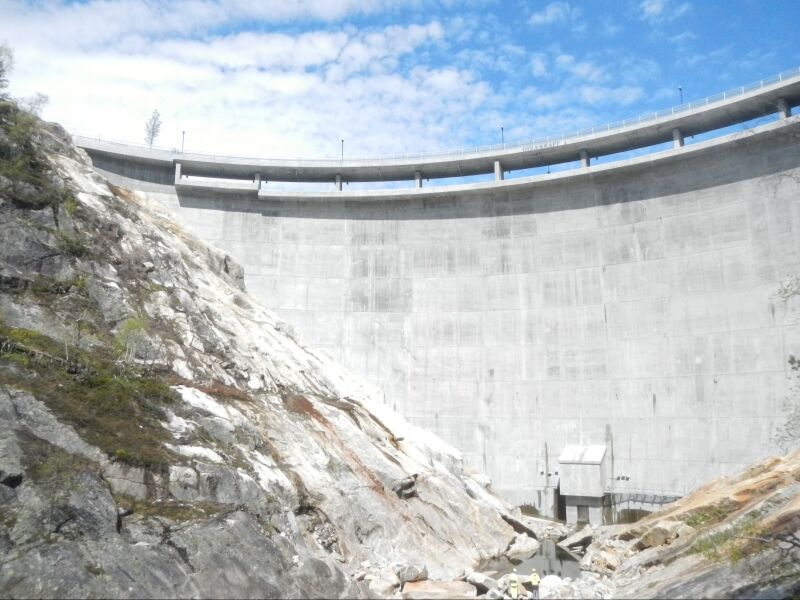
Sarvsfossen (photo 1) is the largest concrete arch dam built in
Norway since the Alta dam built in the 1980s. In this respect, it
is a unique structure in Norwegian context. The dam thickness
tapers from 6.5 m at the bottom to 2.3 m at an elevation of 43 m
higher. The total concrete volume is approximately 19 000 m
3.
The dam is not anchored to the bedrock by bolts, but relies on
its selfweight and the double curvature shape to transfer loads
into the abutments. In simple terms the water pushes the arch
structure towards the abutments.
The general purpose finite element (FE) software Ansys, and a
post-processor software performing non-linear concrete
design of reinforced shell elements, MultiCon (Brekke et al.
1994, Multiconsult n.d.), was used for the design of Sarvsfos-
sen dam. This has been the preferred tool for design of several
large concrete structures in the offshore industry. This analysis
package has been applied to model dam structures as they
have many similar attributes to a typical gravity base concrete
structure (GBS).
After 2,5 years construction time, in September 2014 the
50 meter high double curvature Sarvsfossen dam was
completed in Bykle in the Aust-Agder province as part of
the 'Brokke Nord/Sør' project. It is the largest concrete
dam built in Norway since the 1980s. The structure dams
the river Otra that flows south through the valley of
Setesdalen. The annual energy output of this hydropower -
project is 69 GWh. Together with additional energy from
existing stations downstream, a total of 175 GWh of
renewable energy has been added to the regional grid.
Along the 145 m long dam crest a concrete bridge is built,
connecting the Bykle community center in the west to the
rural district Stavnes in the east.
thema
Sarvsfossen Dam 3 2017
39
The FE model of the dam, which consist of solid elements, is illustrated in
figure 2. The model includes a bedrock volume which provides an elastic
foundation for the dam. Between the concrete and bedrock elements, there
are contact elements that can simulate sliding and/or uplift in the contact
interface. The contact introduces non-linearities in the FE model (NLFEA).
The contact region is illustrated in green in figure 2b.
In addition to several water level configurations, ice, temperature and earth-
quake loads are simulated in the FE analysis (FEA). The rules for combination
of loads, including applicable load factors, follow Norwegian Water Resources
and Energy Directorate's guidelines for concrete dams (NVE 2005). This
document states that the currently applicable Norwegian design code for
concrete structures should be used, but with some special rules on e.g. load
factors. The Norwegian Dam Regulations refer to general use of Eurocode 2:
Design of concrete structures (Norwegian Standard 2008). This standard was
initially used as a basis for design in agreement with the Norwegian Water
Resources and Energy Directorate. However, due to its good track record
for concrete structures with large shell thickness in a marine environment it
was later decided to use the previous general concrete standard NS 3473
(Norwegian Standard 2003) as design framework. This standard has a good
reputation from design of offshore concrete structures, including Concrete
Gravity Base Structures (GBSes) in the North Sea. It is still used for this type
of application. Through the process, it was also found that the shear tension
capacity for concrete sections with large thickness is significantly higher in
NS 3473 compared to Eurocode 2.
Simulation vs. on-site measurements
It was considered important to introduce contact interface elements in the
FEA since no anchoring of the reinforced concrete to bedrock was part of the design of the dam. If the dam was modelled fixed to the
bedrock, this would lead to very high reinforcement intensities
in the vertical direction in the lower part of the dam on the
water side due to clamping of the three-dimensional shell
structure. This was found unfeasible since it would require a
large amount of anchors/bolts and consequently it would
increase the construction cost substantially. Modelling the dam
Erlend Eithun Aasheim,
Jan Lindemark,
Audun Hanssen Lundberg
Multiconsult ASA
Morten Engen
Multiconsult ASA / NTNU 1
The Sarvsfossen dam and bridge from downstream sidecredits: Multiconsult2 FE model with solid element mesh: (a) dam and bedrock (view upstream),
(b) dam (view downstream)
3 Deformation of dam with full reservoir (deformation scale 400:1):
(a) Vector sum of displacement [m], (b) vertical deformation [m]
2a
2b
3a 3b
.001669 .005008
.003339
.006677
.008347 .010016
.011686 .013355
.015024
0 -.202E-06
.685E-03.00137 .002055.00274
.015024 .001027
.001713.002398.003083
MN
verical uplift in FEM:
2.7 mm
3a 3b
Sarvsfossen Dam 3 2017
40
4 Relation between the water level
and uplift of the upstream dam toe
5 Construction of the dam
credits: Multiconsult
6 Section of transition between foun-
dation block and bottom of dam
7 Overview of dam site
credits: Otra Kraft
vertical uplift of 3.5 mm was measured (fig. 4), while the
maximum uplift was estimated to 2.7 mm in the FEA (fig. 3).
Construction
Initially the contractor investigated the use of sliding formwork
for construction of the major part of the dam. The complex,
double curvature shape combined with the asymmetrical layout
proved this technique to be neither technically nor economi-
cally feasible. It was concluded to construct the dam in 5 m lifts
divided horizontally in sections approximately 9 m wide result-
ing in 128 blocks to be cast. A Doka formwork system was used
(photo 5). Towards the eastern abutment, the rock excavation
on the upstream face was carried out as smooth excavation
including stitch drilling. As a result, this face of the rock acted
as the formwork for the twisting dam and the connection was
improved by anchoring reinforcement in the rock.
Shear keys with upstream and downstream water stops were
designed for both horizontal and vertical joints. A double set of
injection hoses was installed, one for use before and one for use
after impoundment. The reinforcement is continuous over
both vertical and horizontal joints. There are wedges in the
vertical edges of the separate casting phases to improve the
interaction, especially on shear.
The predicted uplift of the upstream dam toe required careful
considerations concerning water tightness of the foundation.
The FE model showed the contact area to be relatively small in
the bottom part of the dam while the contact area was larger
in the sloping parts of the foundation. Due to poor quality of
as fixed to bedrock would also underestimate lateral deforma-
tions. Lateral deformations of the dam were important in the
design of the bridge structure.
As a consequence, it was decided to simulate the global
response due to various load conditions in terms of non-linear
contact analyses and rely on the dam's curvature vault shape to
transfer forces to the abutments where uplift and sliding were
permitted. The deformation of the structure for a typical load
combination including water pressure is presented in figure 3.
The plot to the left shows the vector sum, i.e. a combination of
the three translational deformation components, in an isomet-
ric view, while the plot to the right shows the vertical deforma-
tion component in a section through the dam center. An uplift
effect is observed at the bottom of the dam on the water side.
Note that water pressure in the interface between bedrock and
concrete was included with a linear distribution from the
upstream side to the downstream side to simulate the effect of
water intrusion.
In order to monitor the uplift during execution and operation
of the dam, it was decided to install extensometers on three
locations on the water side of the base of the dam before water
filling was initiated. These extensometers measured separation
between bedrock and the concrete structure above. Data from
the extensometers are presented in figure 4. The measured
uplift values are given together with the water level.
The measurements were conducted continuously through the
first filling sequence of the dam after construction completion in
April 2014. Good agreement with the predicted uplift in the FEA
was observed. Both the water level for which uplift was initiated
and the final uplift value for a full dam reservoir, were predicted
with good accuracy. For the full dam reservoir a maximum
5
4
45
40
35
30
25
20
15
10
5
0
water level [m]
2014 4
3.5
3
2.5
2
1.5
1
0.5
0
uplift [mm]
06 Apr
13 Apr20 Apr 25 May
27 Apr water level
uplift east side
uplift centre
uplift west side
04 May 11 May 18 May 08 Jun
01 Jun
thema
Sarvsfossen Dam 3 2017
41
? R EFERENCES
1 Lindemark, J., Aasheim, E. E., Mork, R. O., & Bjønnes, T. (2015). Sarvsfos-
sen Dam ? Design of a Norwegian Concrete Arch Dam, ICOLD 25th
Congress / ICOLD 83rd Annual Meeting, Symposium Hydropower'15.
2 Brekke, D.-E., Åldstedt, E., & Grosch, H. (1994). Design of Offsore
Concrete Structures Based on Postprocessing of Results from Finite
Element Analysis (FEA): Methods, Limititations and Accuracy, Proc. Of
4th Intl. Offshore & Polar Engineering Conference.
3 Guidelines for concrete dams (2005). Oslo: Norwegian Water Resources
and Energy Directorate (NVE). Multiconsult. (n.d.). MultiCon - Concrete
shell design post-processing program (developed by Dan Evert Brekke).
4 Ansys. (n.d.). www.ansys.com.
5 Eurocode 2: Design of concrete structures - Part 1-1: General rules and
rules for buildings. NS-EN 1992-1-1:2004+NA:2008. Norwegian Standard
(2008).
6 NS3473: Concrete structures - Design and detailing rules (6th edition).
Norwegian Standard. (2003).
the bedrock, it was decided that a horizontal 30 m wide foun-
dation block in the middle, underneath the dam required
deeper excavation, i.e. 5-8 m. This block was cast with an
expansion joint towards the dam (fig. 6). A shear key with an
upstream and downstream water-stop and a swelling tape in
the middle was installed. This measure should prevent leakage
in the joint between the bedrock and the concrete caused by
uplift of the dam toe. The completed dam structure is illus-
trated in photo 1 and 7.
Conclusion
In the Sarvsfossen project it has been favorable to establish a
3D finite element model with solid elements for concrete design
purposes. This allows for estimations of the structural response
without the need for (costly) conservative approximations.
Using specialized design software for concrete shell structures,
the necessary reinforcement amounts where efficiently calcu-
lated, satisfying relevant requirements in the ultimate and
serviceability limit state. In particular, it was important to
represent the complex geometric shape of the large concrete
shell structure and its boundary conditions appropriately. After
completion of the dam, this has been confirmed by on-site
measurements that show satisfactory agreement with simulated
data. It was concluded that one could solely rely on the geometric
shape of the structure and its selfweight to transfer loads to the
abutments. This facilitated a faster construction schedule and
economic savings.
?
Acknowledgements
Thanks to Otra Kraft for providing uplift data from extensometers
and pictures of the dam.
7
6
swelling
tape waterstop upstream side
foundation blockswelling
tape
waterstop
D
C
A3
(A4) A1
(A2)
B3
(B4)
A B1
(B2)D
C
Sarvsfossen Dam 3 2017

Reacties